物理学者(ポスドク)による日々の研究生活のメモ書きです ( python/emacs/html/Japascript/シェルスクリプト/TeX/Mac/C言語/Linux/git/tmux/R/ポケモンGO)
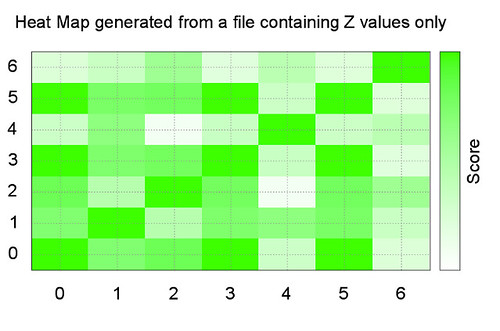
gnuplotの公式demoに参考になりそうなものがあったのでこれをベースに作って行く
■ 参考 :gnuplot demo script: heatmaps.dem
これで書いたのがこんな感じ
 次にやりたいのは、このデータの横軸と縦軸の値を0~6とか意味のない数字じゃなくて、データの名前にしたい
# keynoteで手で修正するのは邪道派
# それに手間だし、あとあとデータを見たときに中身がすぐにわかるようにしておきたい
一応、こんな感じでOKなはず
そうすると、今度は上に突き抜けたので
■ 参考 : gnuplot Heatmap with label and score from different columns data
もう眠いので、画像はなしで・・・
# 2015/9/16 追記
一部の括弧が閉じていなかったので追記
# 2015/9/17 追記
あとで気づいたけど、グラフの縦軸のラベルがこのままだとなんか嫌
どうなっているかというと
これだと、左下から右上に値が1になるラインがのびてしまう
これを
どっちでも良いけど、自分は前者のほうが好み
この設定を外したいときはreverseを消すだけでいいし
けどそのときは
# 2015/9/17 さらに追記
hoge.txtってデータのheat mapを書くスクリプトはこんなの・・・
heat mapの各四角の間を白い線をいれてみた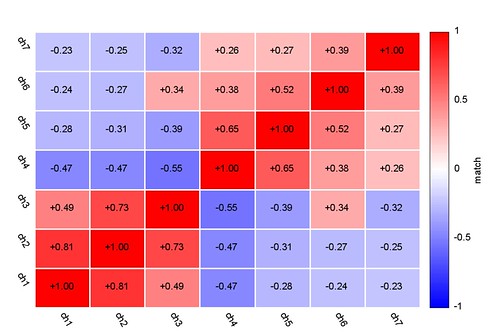
一応こんなのもあるけど、このままではうまくいかなかった・・・
Gnuplot plot 2D matrix with image, want to draw borders for each cell
(2015/10/19 追記)
文字の色を白地にするのはどうすれば良いか?
■ 参考 Set variable textcolor and point color with labels style in gnuplot
ツイート
■ 参考 :gnuplot demo script: heatmaps.dem
これで書いたのがこんな感じ
次にやりたいのは、このデータの横軸と縦軸の値を0~6とか意味のない数字じゃなくて、データの名前にしたい# keynoteで手で修正するのは邪道派
# それに手間だし、あとあとデータを見たときに中身がすぐにわかるようにしておきたい
一応、こんな感じでOKなはず
set term png font "arial,11" fontscale 1.4
unset key
set nocbtics
set cblabel "Score"
set cbtics scale 0
set cbrange [0:1] noreverse nowriteback
set palette defined (0 "white", 1 "red")
set xrange[-0.5:6.5]
set yrange[-0.5:6.5]
set output "c11.png"
YTICS="`awk 'BEGIN{getline}{printf "%s ",$1}' "hoge.txt" ' "
XTICS="`head -1 "hoge.txt"`"
set for [i=1:words(XTICS)] xtics ( word(XTICS,i) i-1 )
set for [i=1:words(YTICS)] ytics ( word(YTICS,i) i-1 )
set xtics rotate by -60
set ytics rotate by -60
set tmargin 3
plot "<awk '{$1=\"\"}1' 'hoge.txt' | sed '1 d'" matrix w image, '' \
matrix using 1:2:($3==0 ? " " : sprintf("%.4f",$3)) with labels
読み込むデータフォーマットはunset key
set nocbtics
set cblabel "Score"
set cbtics scale 0
set cbrange [0:1] noreverse nowriteback
set palette defined (0 "white", 1 "red")
set xrange[-0.5:6.5]
set yrange[-0.5:6.5]
set output "c11.png"
YTICS="`awk 'BEGIN{getline}{printf "%s ",$1}' "hoge.txt" ' "
XTICS="`head -1 "hoge.txt"`"
set for [i=1:words(XTICS)] xtics ( word(XTICS,i) i-1 )
set for [i=1:words(YTICS)] ytics ( word(YTICS,i) i-1 )
set xtics rotate by -60
set ytics rotate by -60
set tmargin 3
plot "<awk '{$1=\"\"}1' 'hoge.txt' | sed '1 d'" matrix w image, '' \
matrix using 1:2:($3==0 ? " " : sprintf("%.4f",$3)) with labels
ch1 ch2 ch3
ch1 0 2 3
ch2 4 5 6
ch3 7 8 9
みたいな感じch1 0 2 3
ch2 4 5 6
ch3 7 8 9
set xtics rotate by -60
は以前やった、labelが長いので回転させているそうすると、今度は上に突き抜けたので
set tmargin 3
で余白を広げた■ 参考 : gnuplot Heatmap with label and score from different columns data
もう眠いので、画像はなしで・・・
# 2015/9/16 追記
一部の括弧が閉じていなかったので追記
# 2015/9/17 追記
あとで気づいたけど、グラフの縦軸のラベルがこのままだとなんか嫌
どうなっているかというと
e
d
c
b
a
a b c d e
になっているd
c
b
a
a b c d e
これだと、左下から右上に値が1になるラインがのびてしまう
これを
a
b
c
d
e
a b c d e
みたいにしたいときはb
c
d
e
a b c d e
set yrange[-0.5:6.5] reverse
または
set yrange[6.5:-0.5]
みたいにすればOKまたは
set yrange[6.5:-0.5]
どっちでも良いけど、自分は前者のほうが好み
この設定を外したいときはreverseを消すだけでいいし
けどそのときは
a b c d e
a
b
c
d
e
にしたいんだよなぁ〜・・・・a
b
c
d
e
# 2015/9/17 さらに追記
hoge.txtってデータのheat mapを書くスクリプトはこんなの・・・
heat mapの各四角の間を白い線をいれてみた
#!/bin/sh
output=hoge.txt
gnuplot <<EOF
set term png font "arial,11" fontscale 1.4
set output "hoge.png"
unset key
set nocbtics
set cblabel "match"
set cbtics scale 0
set cbrange [-1:1] noreverse nowriteback
set palette defined (-1 "blue", 0 "white",1 "red")
set xrange[-0.5:6.5]
set yrange[-0.5:6.5]
#set yrange[-0.5:6.5] reverse
#set yrange[6.5:-0.5]
YTICS="`awk 'BEGIN{getline}{printf "%s ",$1}' "${output}"`"
XTICS="`head -1 "${output}"`"
set for [i=1:words(XTICS)] xtics ( word(XTICS,i) i-1 )
set for [i=1:words(YTICS)] ytics ( word(YTICS,i) i-1 )
set xtics rotate by -60
set ytics rotate by -60
set tmargin 3
set arrow 1 nohead front from -0.5,-0.5 to -0.5,6.5 lw 3 lc rgb "white"
set arrow 2 nohead front from 0.5,-0.5 to 0.5,6.5 lw 3 lc rgb "white"
set arrow 3 nohead front from 1.5,-0.5 to 1.5,6.5 lw 3 lc rgb "white"
set arrow 4 nohead front from 2.5,-0.5 to 2.5,6.5 lw 3 lc rgb "white"
set arrow 5 nohead front from 3.5,-0.5 to 3.5,6.5 lw 3 lc rgb "white"
set arrow 6 nohead front from 4.5,-0.5 to 4.5,6.5 lw 3 lc rgb "white"
set arrow 7 nohead front from 5.5,-0.5 to 5.5,6.5 lw 3 lc rgb "white"
set arrow 8 nohead front from 6.5,-0.5 to 6.5,6.5 lw 3 lc rgb "white"
set arrow 10 nohead front from -0.5,-0.5 to 6.5,-0.5 lw 3 lc rgb "white"
set arrow 11 nohead front from -0.5,0.5 to 6.5,0.5 lw 3 lc rgb "white"
set arrow 12 nohead front from -0.5,1.5 to 6.5,1.5 lw 3 lc rgb "white"
set arrow 13 nohead front from -0.5,2.5 to 6.5,2.5 lw 3 lc rgb "white"
set arrow 14 nohead front from -0.5,3.5 to 6.5,3.5 lw 3 lc rgb "white"
set arrow 15 nohead front from -0.5,4.5 to 6.5,4.5 lw 3 lc rgb "white"
set arrow 16 nohead front from -0.5,5.5 to 6.5,5.5 lw 3 lc rgb "white"
set arrow 17 nohead front from -0.5,6.5 to 6.5,6.5 lw 3 lc rgb "white"
plot "<awk '{\$1=\"\"}1' '${output}' | sed '1 d'" matrix w image, '' \
matrix using 1:2:(\$3==0 ? " " : sprintf("\%+-.2f",\$3)) with labels
EOF
データはこんなのoutput=hoge.txt
gnuplot <<EOF
set term png font "arial,11" fontscale 1.4
set output "hoge.png"
unset key
set nocbtics
set cblabel "match"
set cbtics scale 0
set cbrange [-1:1] noreverse nowriteback
set palette defined (-1 "blue", 0 "white",1 "red")
set xrange[-0.5:6.5]
set yrange[-0.5:6.5]
#set yrange[-0.5:6.5] reverse
#set yrange[6.5:-0.5]
YTICS="`awk 'BEGIN{getline}{printf "%s ",$1}' "${output}"`"
XTICS="`head -1 "${output}"`"
set for [i=1:words(XTICS)] xtics ( word(XTICS,i) i-1 )
set for [i=1:words(YTICS)] ytics ( word(YTICS,i) i-1 )
set xtics rotate by -60
set ytics rotate by -60
set tmargin 3
set arrow 1 nohead front from -0.5,-0.5 to -0.5,6.5 lw 3 lc rgb "white"
set arrow 2 nohead front from 0.5,-0.5 to 0.5,6.5 lw 3 lc rgb "white"
set arrow 3 nohead front from 1.5,-0.5 to 1.5,6.5 lw 3 lc rgb "white"
set arrow 4 nohead front from 2.5,-0.5 to 2.5,6.5 lw 3 lc rgb "white"
set arrow 5 nohead front from 3.5,-0.5 to 3.5,6.5 lw 3 lc rgb "white"
set arrow 6 nohead front from 4.5,-0.5 to 4.5,6.5 lw 3 lc rgb "white"
set arrow 7 nohead front from 5.5,-0.5 to 5.5,6.5 lw 3 lc rgb "white"
set arrow 8 nohead front from 6.5,-0.5 to 6.5,6.5 lw 3 lc rgb "white"
set arrow 10 nohead front from -0.5,-0.5 to 6.5,-0.5 lw 3 lc rgb "white"
set arrow 11 nohead front from -0.5,0.5 to 6.5,0.5 lw 3 lc rgb "white"
set arrow 12 nohead front from -0.5,1.5 to 6.5,1.5 lw 3 lc rgb "white"
set arrow 13 nohead front from -0.5,2.5 to 6.5,2.5 lw 3 lc rgb "white"
set arrow 14 nohead front from -0.5,3.5 to 6.5,3.5 lw 3 lc rgb "white"
set arrow 15 nohead front from -0.5,4.5 to 6.5,4.5 lw 3 lc rgb "white"
set arrow 16 nohead front from -0.5,5.5 to 6.5,5.5 lw 3 lc rgb "white"
set arrow 17 nohead front from -0.5,6.5 to 6.5,6.5 lw 3 lc rgb "white"
plot "<awk '{\$1=\"\"}1' '${output}' | sed '1 d'" matrix w image, '' \
matrix using 1:2:(\$3==0 ? " " : sprintf("\%+-.2f",\$3)) with labels
EOF
ch1 ch2 ch3 ch4 ch5 ch6 ch7
ch1 1.0000 0.8055 0.4939 -0.4707 -0.2836 -0.2430 -0.2348
ch2 0.8055 1.0000 0.7290 -0.4726 -0.3066 -0.2730 -0.2480
ch3 0.4939 0.7290 1.0000 -0.5452 -0.3945 0.3389 -0.3166
ch4 -0.4706 -0.4726 -0.5452 1.0000 0.6523 0.3800 0.2628
ch5 -0.2836 -0.3067 -0.3945 0.6523 1.0000 0.5164 0.2709
ch6 -0.2430 -0.2730 0.3389 0.3800 0.5164 1.0000 0.3927
ch7 -0.2348 -0.2480 -0.3166 0.2628 0.2709 0.3927 1.0000
一応こんなのもあるけど、このままではうまくいかなかった・・・
Gnuplot plot 2D matrix with image, want to draw borders for each cell
(2015/10/19 追記)
文字の色を白地にするのはどうすれば良いか?
plot "<awk '{\$1=\"\"}1' '${output}' | sed '1 d'" matrix w image, '' \
matrix using 1:2:(\$3==0 ? " " : sprintf("\%+-.4f",\$3)) with labels lc rgb "white"
みたいな感じでいけるかと思ったけど、変わらずmatrix using 1:2:(\$3==0 ? " " : sprintf("\%+-.4f",\$3)) with labels lc rgb "white"
plot "<awk '{\$1=\"\"}1' '${output}' | sed '1 d'" matrix w image, '' \
matrix using 1:2:(\$3==0 ? " " : sprintf("\%+-.4f",\$3)) with labels textcolor rgb "white"
でOKmatrix using 1:2:(\$3==0 ? " " : sprintf("\%+-.4f",\$3)) with labels textcolor rgb "white"
■ 参考 Set variable textcolor and point color with labels style in gnuplot
PR
この記事にコメントする
プロフィール
HN:coffee
職業:物理屋(自称)
趣味:映画鑑賞、登山
出身:大阪府の南の田舎
自己紹介:
import MyProfile
import coffee_pote from TWITTER
import amazonのほしい物リスト from WISH_LIST
print "先月子供が産まれました!"
# 最終更新 2022/10/25
職業:物理屋
趣味:映画鑑賞、登山
出身:大阪府の南の田舎
自己紹介:
import MyProfile
import coffee_pote from TWITTER
import amazonのほしい物リスト from WISH_LIST
print "先月子供が産まれました!"
# 最終更新 2022/10/25
カウンター
カテゴリー
ブログ内検索
リンク
相互リンク募集中です
(Twitterにてお知らせください)
Demo scripts for gnuplot version 5 (gnuplotのさまざまなデモ画像と作り方がまとめられている、眺めているだけでできるようになった気分になれる)
gnuplotスクリプトの解説 (米澤進吾さんの個人ページ、gnuplotと言えばこのかた)
gnuplot のページ (Takeno Lab、うちのブログがリンクされていたのでリンク返し)
Twitterから映画の評価が分かる & 映画の鑑賞記録が残せる coco (映画の感想をまとめられるサイト、いつもお世話になっています)
Astronomy Picture of the Day Archive (天文や宇宙関連の最新の話題について画像とともにNASAが説明しているページ)
今日のほしぞら (任意の時刻の空で見える星を表示してくれる、国立天文台が管理している)
GNUPLOTとアニメーション (応用の項目の「見せてあげよう!ラピュタの雷を!!」あたりからすごすぎる)
読書メーター (読んだ本をリストできる便利なサイト)
flickr難民の写真置き場 (20XX年、flickrは有料化の炎に包まれた。あらゆるflickr無料ユーザーは絶滅したかに見えた。 しかし、tumblr移住民は死に絶えてはいなかった。)
教授でもできるMac OS X へのLaTeX, X11, gccのインストレーションと環境設定 (阪大の山中卓さんのwebページ、タイトルにセンスが溢れている、内容は超充実してる、特にTeX関連、学振DCとかPDの申請書類作成時にはお世話になっております)
英語論文執筆用の例文検索サービス (とんでもないものを見つけてしまった・・・・ arXivに収録されている 811,761報の 英語論文から,例文を検索するための検索エンジン)
最新記事
(11/20)
(03/05)
(02/29)
(02/21)
(02/21)
(02/21)
(02/21)
(01/13)
(01/05)
(01/05)